Accessing cluster services
MetalK8s GUI
This GUI is deployed during the Bootstrap installation, and can be used for operating, extending and upgrading a MetalK8s cluster.
Gather required information
Get the workload plane IP of the bootstrap node.
root@bootstrap $ salt-call grains.get metalk8s:workload_plane_ip
local:
    <the workload plane IP>
Retrieve the active
NodePortnumber for the UI (here30923):root@boostrap $ kubectl --kubeconfig=/etc/kubernetes/admin.conf get svc metalk8s-ui -n metalk8s-ui NAME TYPE CLUSTER-IP EXTERNAL-IP PORT(S) AGE metalk8s-ui NodePort 10.104.61.208 <none> 80:30923/TCP 3h
Use MetalK8s UI
Once you have gathered the IP address and the port number, open your
web browser and navigate to the URL http://<ip>:<port>, replacing
placeholders with the values retrieved before.
The login page is loaded, and should resemble the following:

In the bottom left corner of the page, click the link
Accept SSL Certificate for Kubernetes. In the new tab, click the button
Advanced..., then select Accept the risk and continue.
Follow the same steps for the second link, Accept SSL Certificate for Salt.
Go back to the first tab, then log in with the default login / password (admin / admin).
The landing page should look like this:
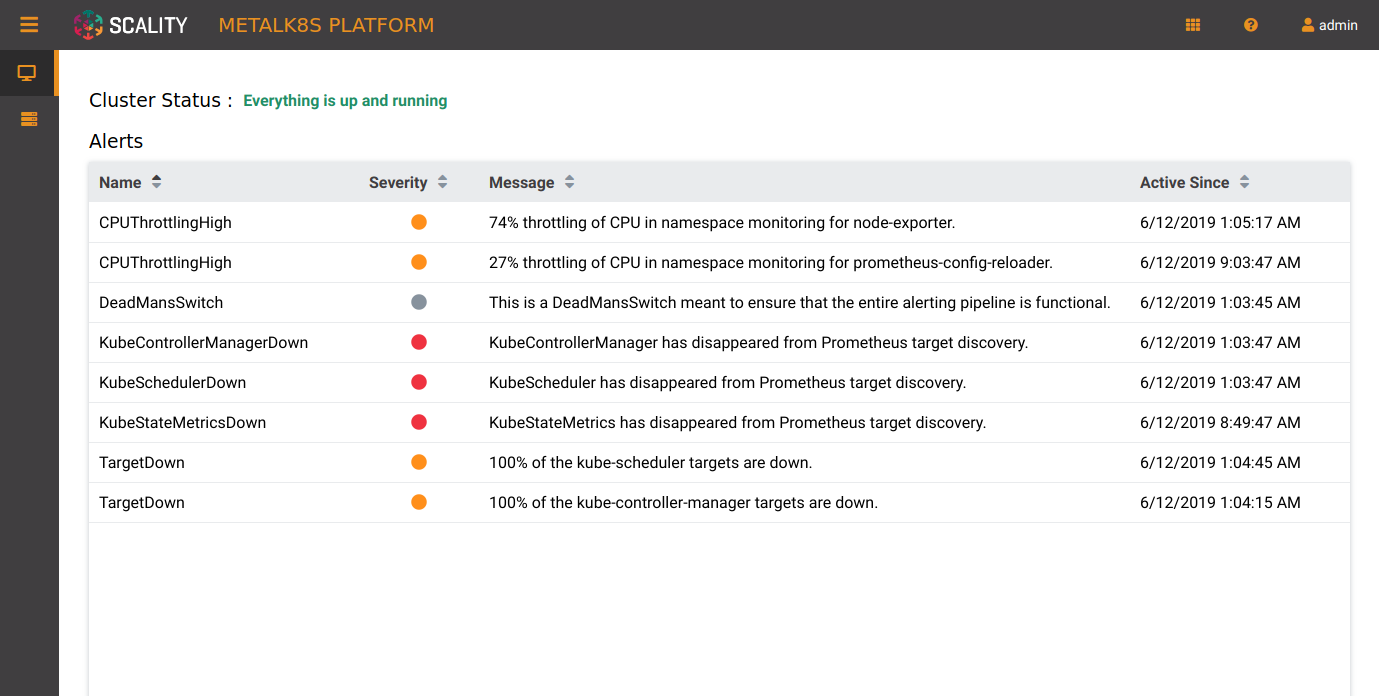
This page displays two monitoring indicators:
the Cluster Status, which evaluates if control-plane services are all up and running
the list of alerts stored in Alertmanager
Grafana
You will first need the latest kubectl version installed on your host.
From the bootstrap node, get the port used by Grafana:
root@bootstrap $ kubectl --kubeconfig=/etc/kubernetes/admin.conf get service grafana -n metalk8s-monitoring

NAME      TYPE        CLUSTER-IP       EXTERNAL-IP   PORT(S)    AGE
grafana   ClusterIP   10.109.125.193   <none>        3000/TCP   1h
Please note the port used by Grafana (here 3000)
To authenticate with the cluster, retrieve the admin kubeconfig on your host:
user@your-host $ scp root@bootstrap:/etc/kubernetes/admin.conf ./admin.conf
Forward the port used by Grafana:
user@your-host $ kubectl --namespace metalk8s-monitoring port-forward svc/grafana 3000
Then open your web browser and navigate to http://localhost:3000
Salt
MetalK8s uses SaltStack to manage the cluster. The Salt Master runs in a Pod on the Bootstrap node.
The Pod name is salt-master-<bootstrap hostname>, and it contains two
containers: salt-master and salt-api.
To interact with the Salt Master with the usual CLIs, open a terminal in the
salt-master container (we assume the Bootstrap hostname to be
bootstrap):
root@bootstrap $ kubectl exec -it -n kube-system -c salt-master --kubeconfig /etc/kubernetes/admin.conf salt-master-bootstrap bash
Todo
how to access / use SaltAPI
how to get logs from these containers