Accessing cluster services
MetalK8s GUI
This GUI is deployed during the Bootstrap installation, and can be used for operating, extending and upgrading a MetalK8s cluster.
Gather required information
Get the control plane IP of the bootstrap node.
root@bootstrap $ salt-call grains.get metalk8s:control_plane_ip
local:
    <the control plane IP>
Use MetalK8s UI
Once you have gathered the IP address and the port number, open your
web browser and navigate to the URL https://<ip>:8443, replacing
placeholders with the values retrieved before.
The login page is loaded, and should resemble the following:

Log in with the default login / password (admin / admin).
The landing page should look like this:
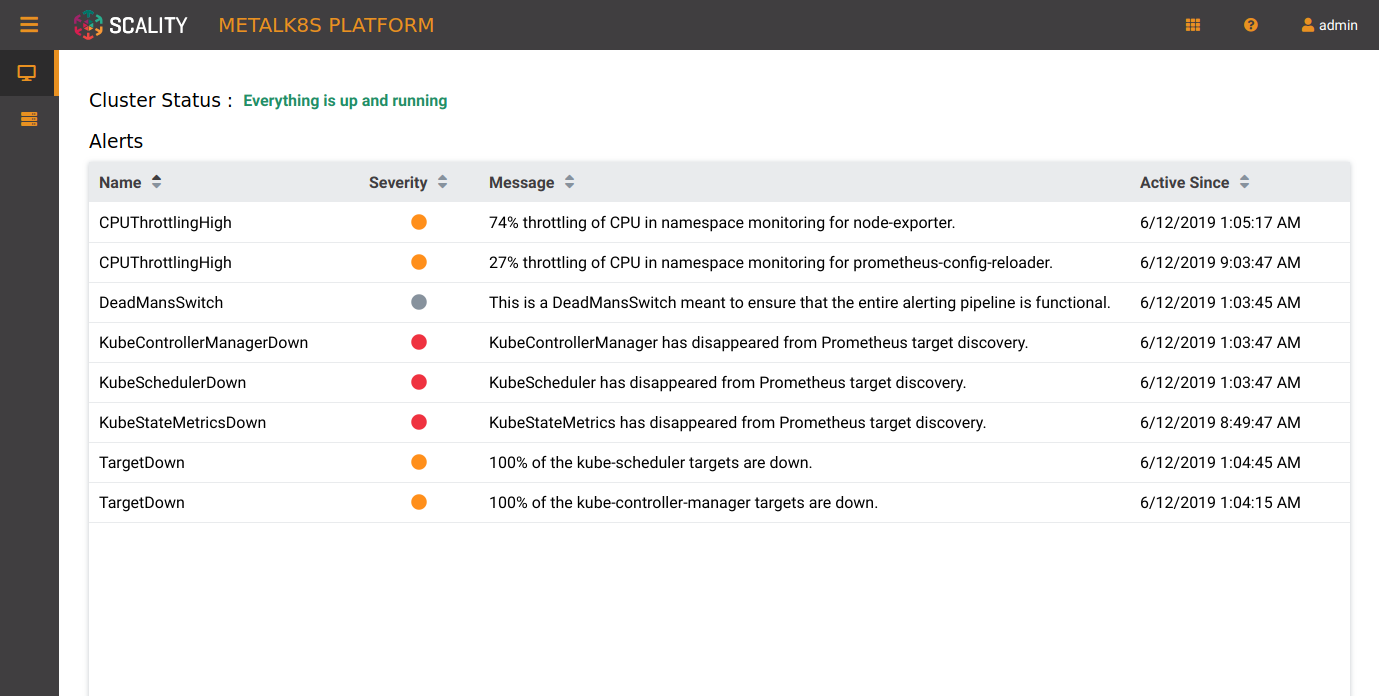
This page displays two monitoring indicators:
the Cluster Status, which evaluates if control-plane services are all up and running
the list of alerts stored in Alertmanager
Grafana
Grafana is available on the same host as the MetalK8s UI, under /grafana.
Log in with the default credentials: admin / admin.
Salt
MetalK8s uses SaltStack to manage the cluster. The Salt Master runs in a Pod on the Bootstrap node.
The Pod name is salt-master-<bootstrap hostname>, and it contains two
containers: salt-master and salt-api.
To interact with the Salt Master with the usual CLIs, open a terminal in the
salt-master container (we assume the Bootstrap hostname to be
bootstrap):
root@bootstrap $ kubectl exec -it -n kube-system -c salt-master --kubeconfig /etc/kubernetes/admin.conf salt-master-bootstrap bash
Todo
how to access / use SaltAPI
how to get logs from these containers